Investing 101: A visual and predictive guide for the rookie investor - Andre
Existing financial data websites such as Yahoo Finance do a good job in providing historical price data and technical indicators, but the beginner investor lacks the knowledge to properly utilise and benefit from these. In addition, we have also identified several gaps in such websites.
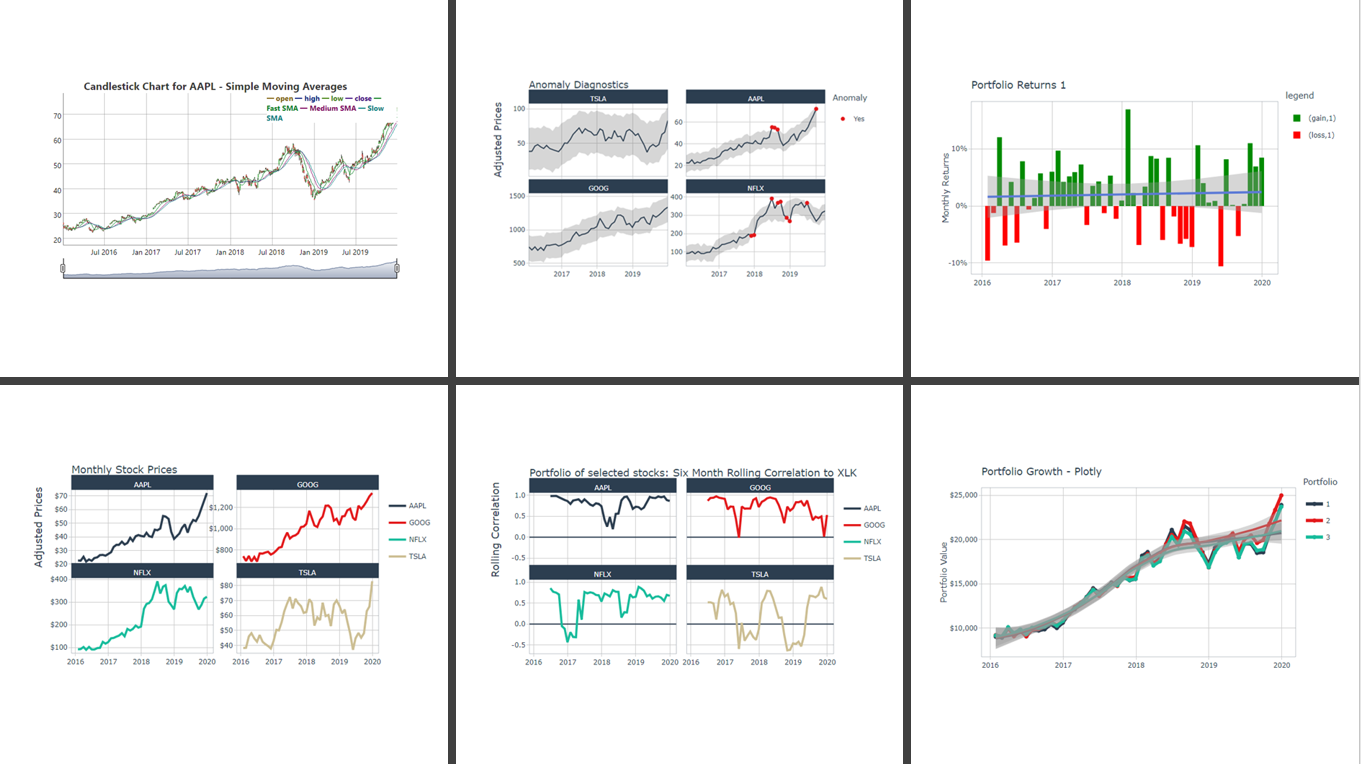
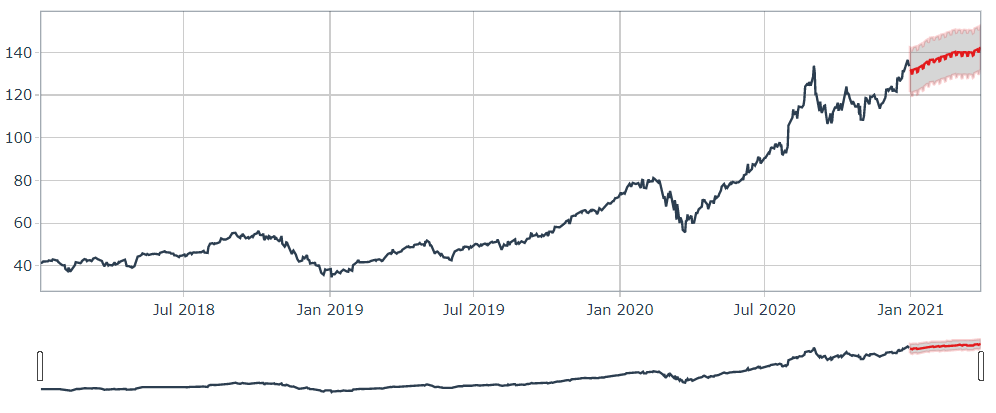
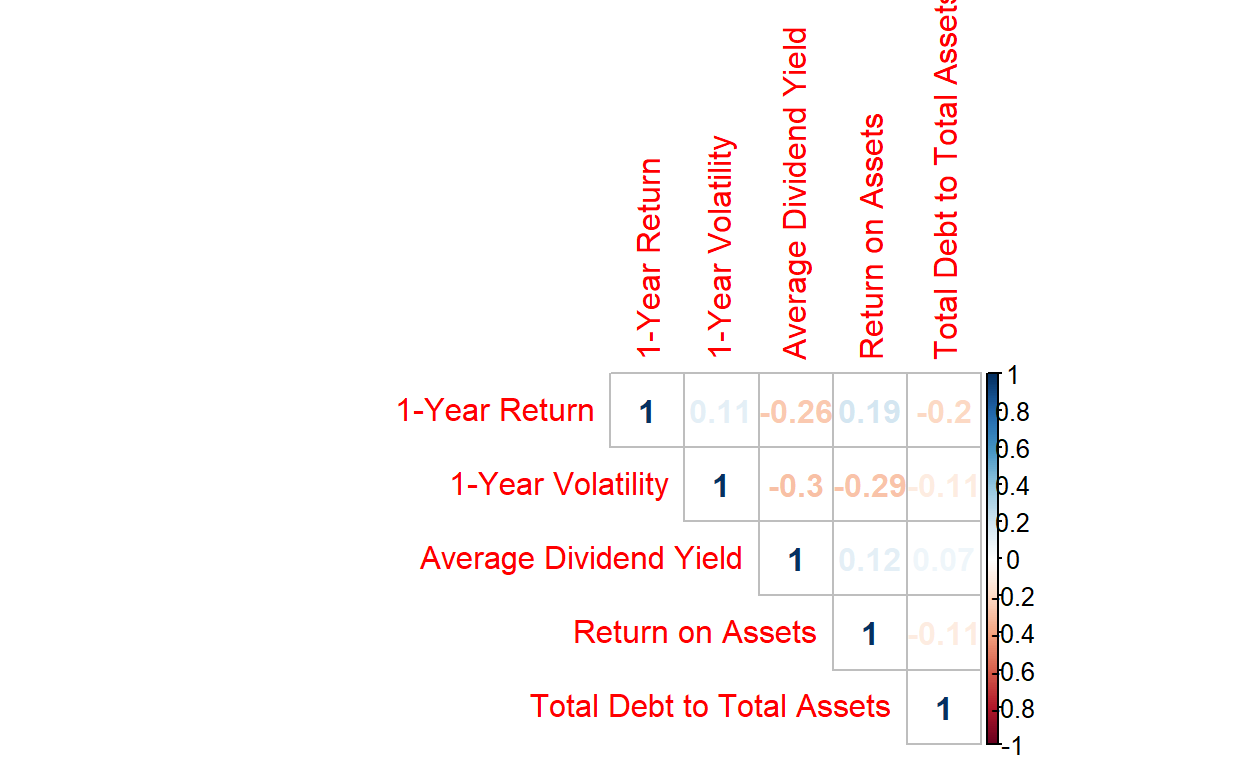
For one, these websites do not provide tools to allow the user to compare stocks meaningfully or zoom in to the statistical properties of financial returns. For example, a user is unable to conduct correlation analysis or visualize the distribution of returns. Secondly, these websites also do not provide any form of forecasting to aid in investors’ decisions.
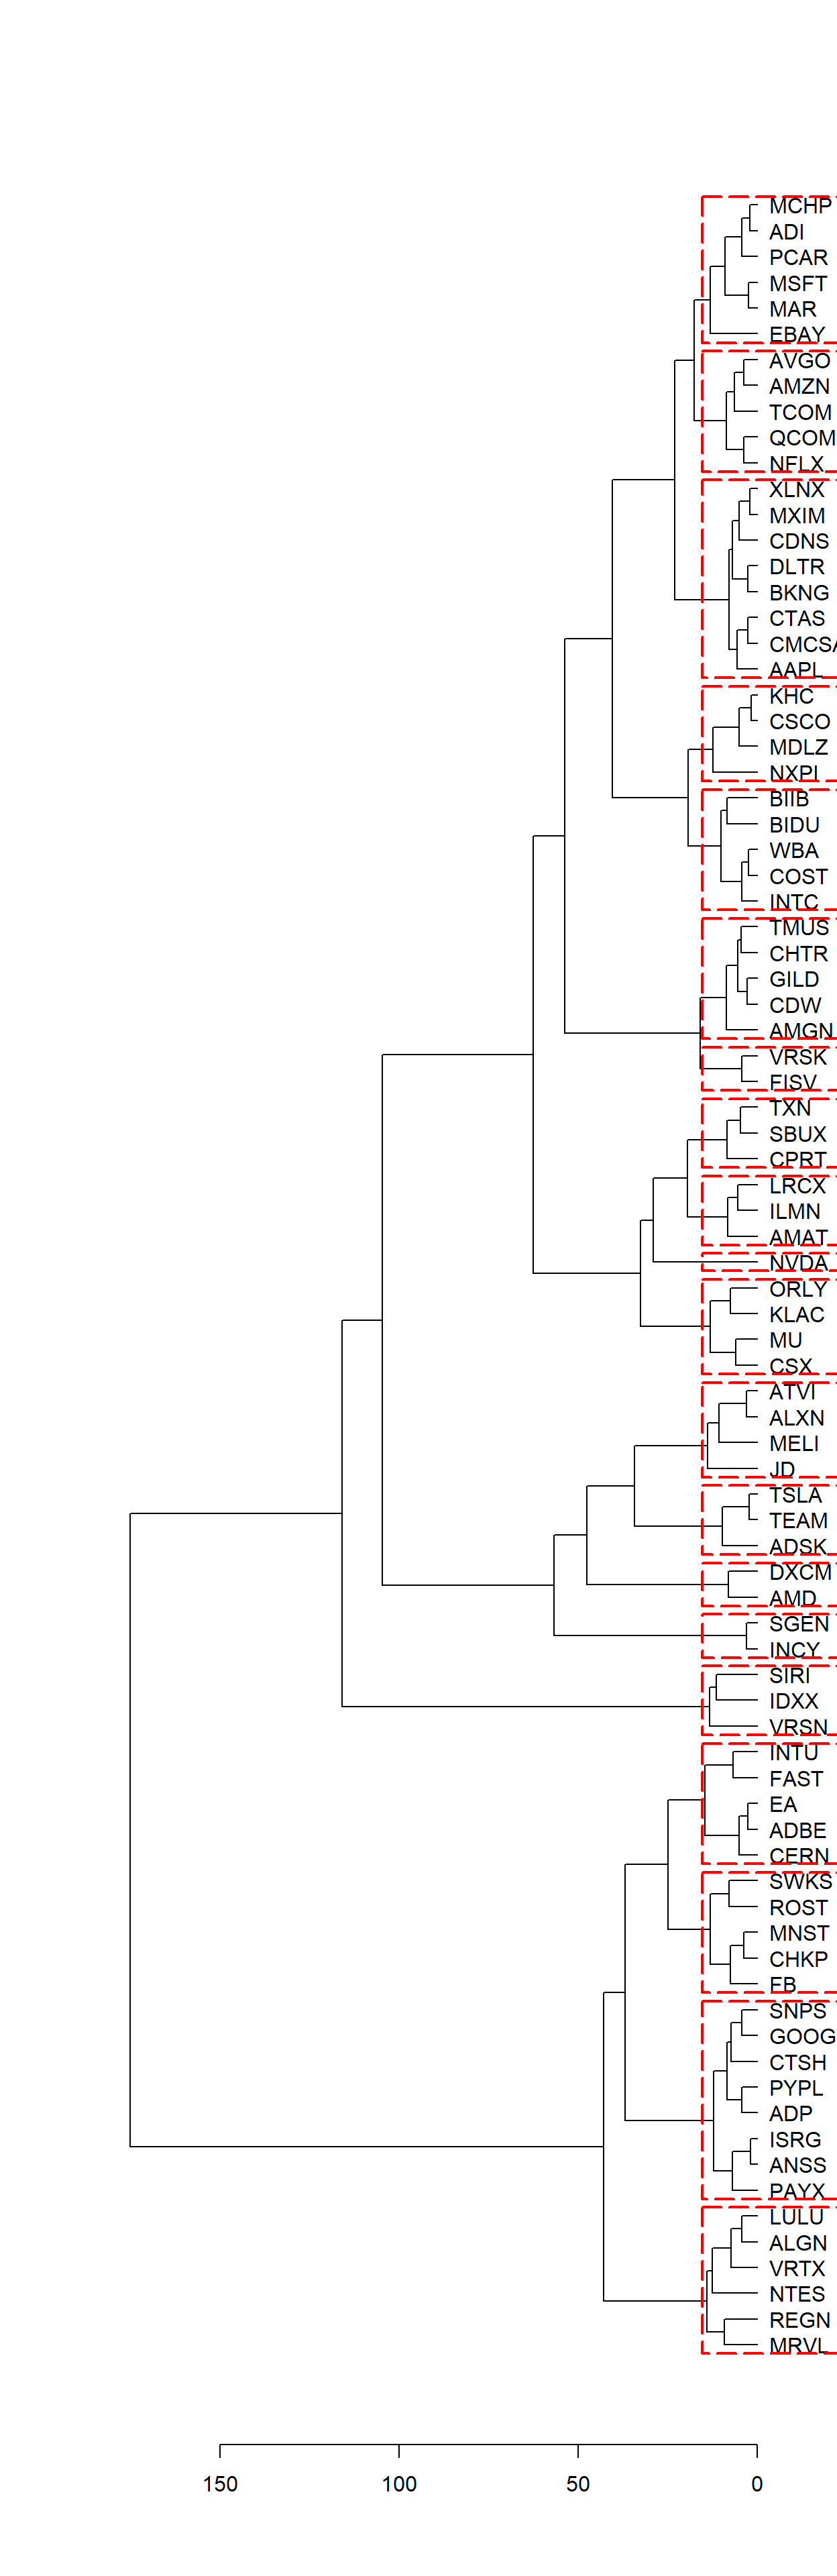
This project aims to improve on the current offering of financial data websites through, Exploratory Data Analysis, Time-Series Forecasting and also Time-Series Clustering.
Investing 101: A visual and predictive guide for the rookie investor - Yi Heen
Existing financial data websites such as Yahoo Finance do a good job in providing historical price data and technical indicators, but the beginner investor lacks the knowledge to properly utilise and benefit from these. In addition, we have also identified several gaps in such websites.
For one, these websites do not provide tools to allow the user to compare stocks meaningfully or zoom in to the statistical properties of financial returns. For example, a user is unable to conduct correlation analysis or visualize the distribution of returns. Secondly, these websites also do not provide any form of forecasting to aid in investors’ decisions.
This project aims to improve on the current offering of financial data websites through, Exploratory Data Analysis, Time-Series Forecasting and also Time-Series Clustering.
Welcome
Investing 101: A visual and predictive guide for the rookie investor
>>>>>>> 30b268cb1d4c401f02082b05a17085d72bba9390
>>>>>>> 4beefcb2d88bd371a0ebf0edb51757a91cada6af
>>>>>>> 47af21e32fd0034ff036bb75caad3a8dae9a2ebb
Investing 101: A visual and predictive guide for the rookie investor - Andre
=======
>>>>>>> 47af21e32fd0034ff036bb75caad3a8dae9a2ebb
Yi Heen, Boey
>>>>>>> 4beefcb2d88bd371a0ebf0edb51757a91cada6af